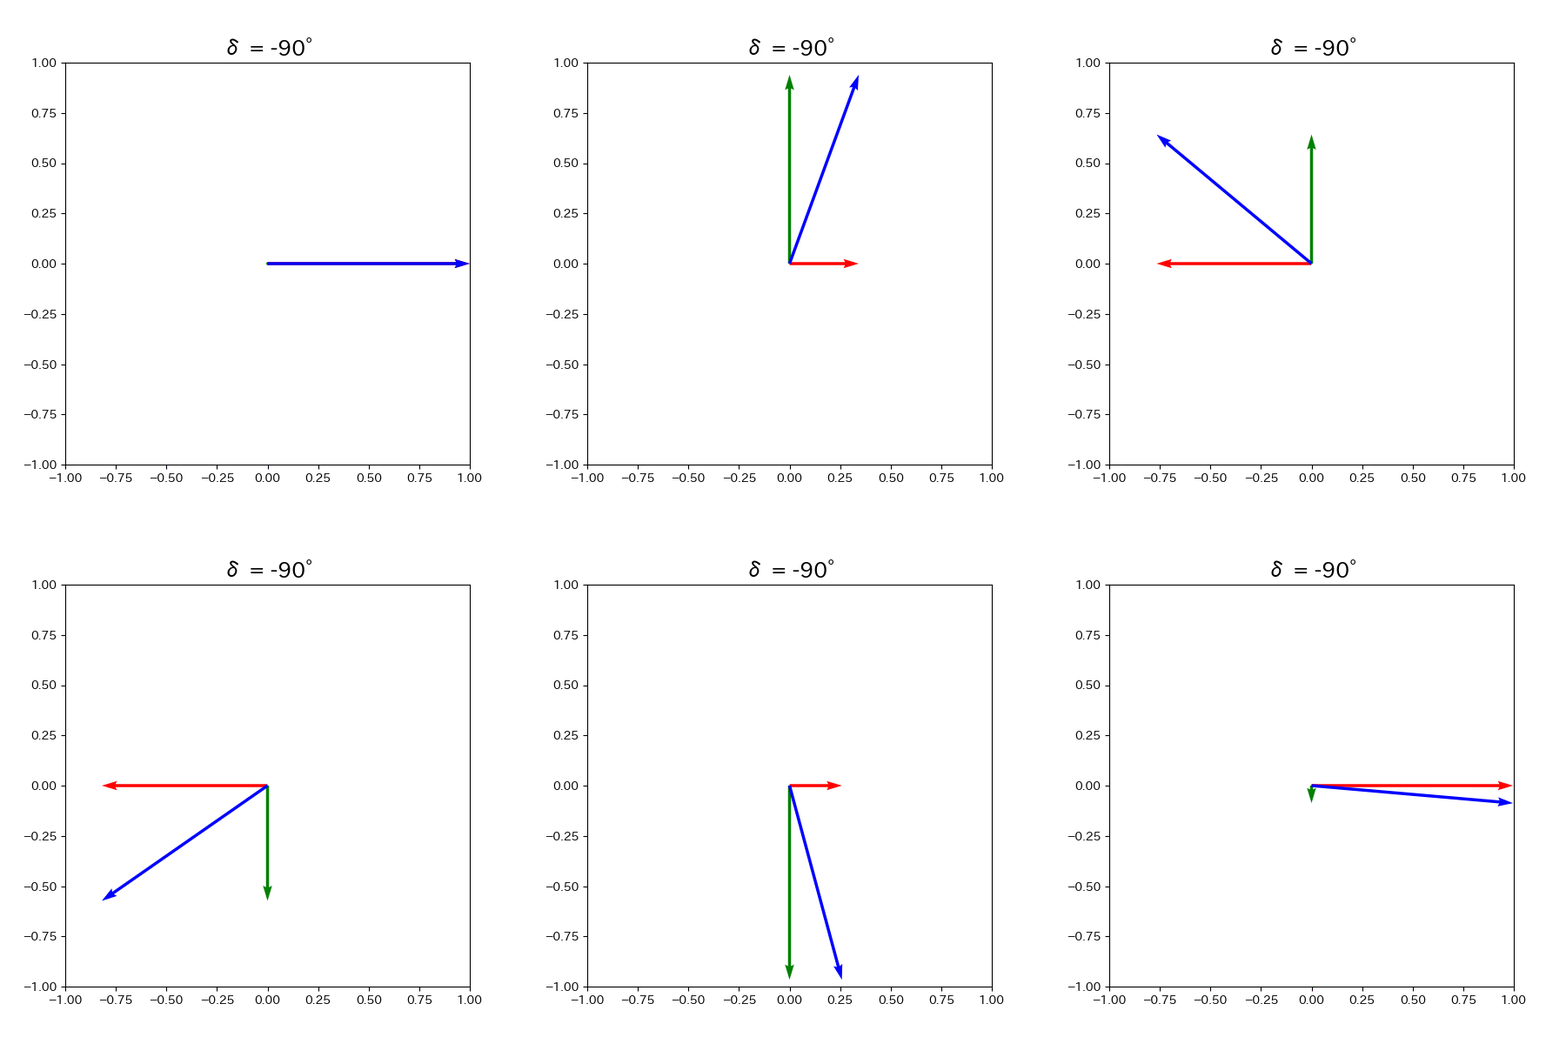
matplotlibを使って、ベクトルのアニメーションを作ってみた
はじめに
最近、光工学という講義で偏光というものを学びました。
円偏光、楕円偏光、直線偏光とかです。
最初はなぜ楕円を描くのかとかが分からなかったので、理解を深めようと思い、光ベクトルのアニメーションを作りました。
matplotlibのquiverを使ったアニメーションを説明したウェブサイトがなかったので記事にしてみました。
実装
実行環境
Windows10
Python 3.6.2
Anaconda
ライブラリのインポート
import matplotlib.pyplot as plt
import matplotlib.animation as animation
import numpy as np
普通のベクトルグラフ
まずはアニメーションではないベクトルのグラフを作成します。
fig = plt.figure(figsize=(6, 6))
plt.xlim([-1, 1])
plt.ylim([-1, 1])

#角度を定義
deg = -90
delta = np.radians(deg)
theta = 45
theta = np.radians(theta)

#ベクトルを定義
x = np.zeros(3)
y = np.zeros(3)
u = (np.cos(theta), 0, np.cos(theta))
v = (0, np.cos(theta + delta), np.cos(theta + delta))

plt.quiver(x, y, u, v, color=('r','g','b'), angles='xy',scale_units='xy',scale=1)

plt.title("δ = " + str(deg) + "°", fontsize=18)
plt.show()
結果がこちらになります。

赤がX軸方向のベクトル(cos(θ) , 0)、緑がY軸方向のベクトル(0, cos(θ + δ))、青がそれらの合成ベクトル(cos(θ), cos(θ + δ))です。
δは位相差で今回は-90°です。θは位置や時間で変化する変数を表しており、今回は45°の点でのグラフとなってます。
アニメーションにする際には、θを変化させます。
アニメーション作成
グラフの作成とパラメータの代入
fig = plt.figure(figsize=(6, 6))
plt.xlim([-1, 1])
plt.ylim([-1, 1])

deg = -90
delta = np.radians(deg)

x = np.zeros(3)
y = np.zeros(3)
グラフを定義し、位相差を代入、ベクトルの要素の内、x,yを代入しており、ここまでは同じです。
グラフの配列を作成
ims = []
for t in range(0, 360, 5):
    theta = np.radians(t)
    u = (np.cos(theta), 0, np.cos(theta))
    v = (0, np.cos(theta + delta), np.cos(theta + delta))
    im = plt.quiver(x, y, u, v, color=('r','g','b'), angles='xy',scale_units='xy',scale=1)
    ims.append([im])
変数θを5°ずつ変化させてfor文で回していき、グラフを取得し、各グラフを配列に格納していきます。
ここで、普通のグラフと同じように
ims.append(im)
とすると、エラーが起こるので気を付けましょう。
アニメーションを表示
plt.title("δ = " + str(deg) + "°", fontsize=18)
ani = animation.ArtistAnimation(fig, ims, interval=50, blit=True)
plt.show()
ani.save("artistanimation_" + str(deg) + ".gif", writer='imagemagick')

位相差が-90°だと反時計回りの円偏光だということが分かりますね。
FuncAnimation
上のコードではArtistAnimationという関数を使ってアニメーションを作成しました。アニメーションにしたい連続したグラフを配列に入れて、それをArtistAnimationの関数に渡すことで、アニメーションを作成します。
アニメーションを作る関数はもう一つあり、それがFuncAnimationという関数です。 FuncAnimationはその名のとおり、グラフを更新する関数をFuncAnimationに渡します。FuncAnimation内で関数にしたがってグラフを更新していき、アニメーションを作成します。 FuncAnimationを使ったコードも書いてみました。
グラフの作成とパラメータの代入
fig = plt.figure(figsize=(6, 6))
plt.xlim([-1, 1])
plt.ylim([-1, 1])

deg = 180
delta = np.radians(deg)
初期ベクトルの設定
X = np.zeros(3)
Y = np.zeros(3)
U = np.array((np.cos(0), 0, np.cos(0)))
V = np.array((0, np.cos(delta), np.cos(delta)))
Q = plt.quiver(X, Y, U, V, color=('r','g','b'), angles='xy', scale_units='xy', scale=1)
ベクトルの更新
unit = 5
def update_quiver(t, Q, X, Y):
    theta = np.radians(t*unit)
    U = np.array((np.cos(theta), 0, np.cos(theta)))
    V = np.array((0, np.cos(theta + delta), np.cos(theta + delta)))

    Q.set_UVC(U,V)

    return Q,
update_quiverがベクトルを更新する関数です。
unitは一回の更新で何度変化させるかを表す数値で、完成したGIFの滑らかさに影響します。
アニメーションを表示
ani = animation.FuncAnimation(fig, update_quiver, fargs=(Q, X, Y), interval=50, frames=360//unit, blit=True)
plt.show()
ani.save("funcanimation_" + str(deg) + ".gif", writer='imagemagick')

位相差が180°だと直線偏光ですね。
おわりに
無事、ベクトルのアニメーションを作ることができました。 しかしグラフを配列に格納するところで何回もエラーが出て、解決策もよく分からずで結構大変でした。
完成してみるとすごく簡単なコードですね。
ちなみにArtistAnimationとFuncAnimationで位相差を同じにして、GIFを作ってみると、ファイルのハッシュ値が一致しました。
全く同じファイルができているということです。
処理時間も大きな差はなかったので、お好みの方でアニメーション作りましょう。
早速、投稿頻度の雲行きが怪しくなってきました。頑張ります。
それではまた今度。
Railsに手を出してみたい......